


TL;DR
Alexa for Shopping brings product facts, customer evidence, offer terms and a generated recommendation together in one card.
Across more than eight million card appearances, review count was the strongest measured correlate of earlier placement. Among similarly rated and reviewed offers, title–prompt word match and price became more prominent. Position also needs context, because 66.5% of heading leaders appeared after overall P1.
For brands, the priority is to get product identity, quantity, price and buying conditions right, then check whether Alexa’s explanation supports the shopper’s actual use.
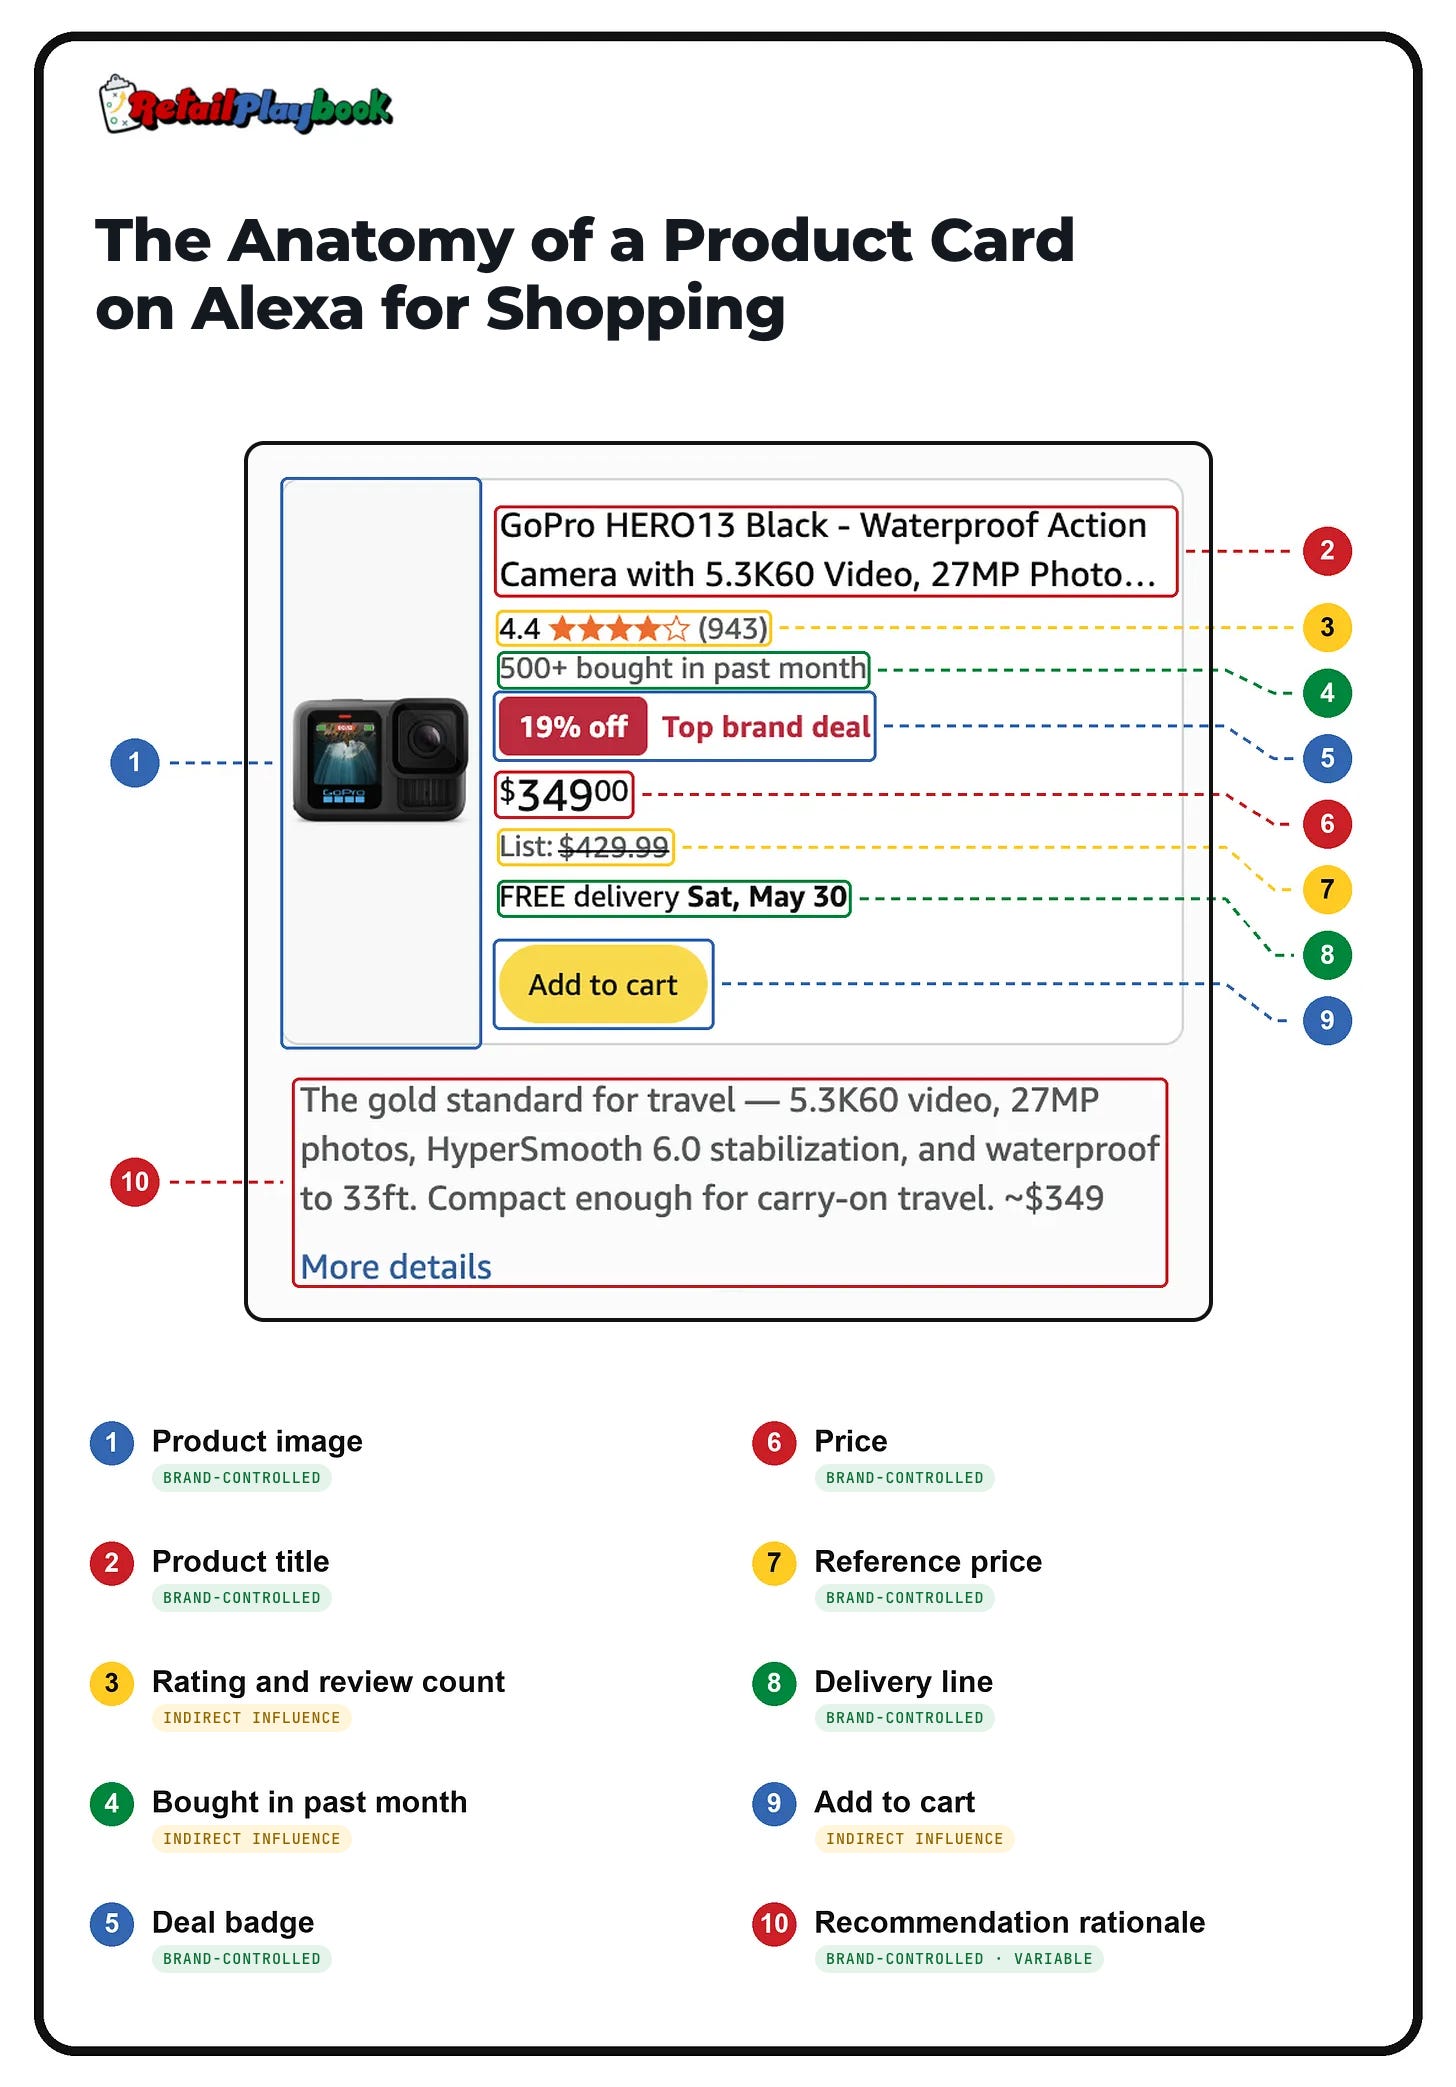
Control tags describe brand or seller inputs. Amazon validates deals and reference prices, determines displayed delivery promises and purchase controls, and generates the recommendation rationale. Price control applies when the brand is the seller.1
Among cards shown under the same heading, the one with more reviews led 62.4% of eligible comparisons. Lower-priced offers led 51.4% in their comparison set, and offers with a deal badge led 48.1%. Those patterns give a brand different reasons to examine fields that appear together on the same card.2
I analyzed more than eight million captured product-card appearances to understand how product facts, commercial terms and recommendation language relate to placement. This study covers the icon-launched Alexa for Shopping experience. Reading a card against the alternatives under its heading makes the competitive comparison more specific, while checking the complete offer reveals what the shopper would actually buy.34
Read the ten facets as one offer
I use the same ten facets throughout the article. A heading and a position describe where the offer appears, while these facets describe the product, its terms and the explanation attached to it.5
Product image
Product title
Rating and review count
Bought in past month
Deal badge
Price
Reference price
Delivery line
Add to cart
Recommendation rationale
GoPro HERO13 Black appears in the illustration with a product image (1) and a title (2) listing 5.3K60 video and 27MP photos. Its title ends with an ellipsis. A reviewer can identify the model, then open the selected offer to establish any package or variation detail hidden by that truncation.6
Rating and review count (3) supply a 4.4 score and 943 reviews. Bought in past month (4) adds a displayed threshold of 500+. Each describes a different aspect of customer evidence, so I keep the score, feedback count and purchase threshold separate when comparing offers.
Deal badge (5), price (6) and reference price (7) form the commercial comparison. Here, the 19% Top brand deal sits beside $349 and a struck-through $429.99 List price. Its reference label identifies the comparison price, and quantity determines what the customer receives for the amount paid.
Delivery line (8) displays FREE delivery and Sat, May 30, followed by the Add to cart control (9). Arrival dates, order minimums and membership conditions need to travel with the offer through the review. Add to cart supplies a purchase action for the configuration shown.
Recommendation rationale (10) presents the camera’s video, stabilization and waterproofing features as reasons to choose it for travel. This creates a second task for the brand reviewer. Product facts need to support both the specifications and the proposed use.78
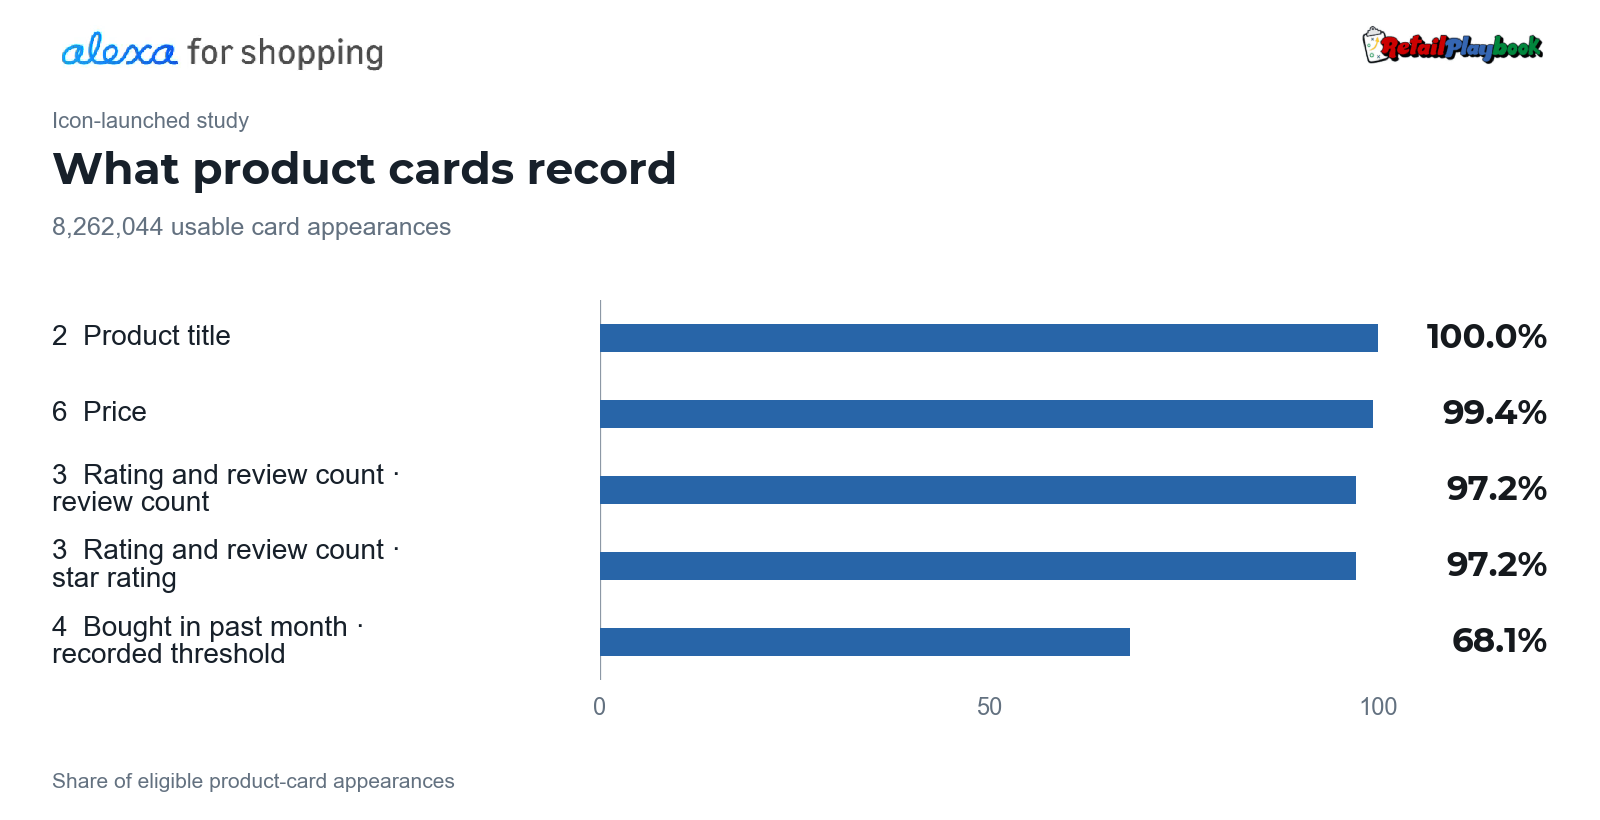
Title text appeared on 100% of usable card appearances, price on 99.35%, and star rating and review count on 97.19% each. In the separately aligned display sample, delivery text appeared on 97.05% and Add to cart on 91.63%. Reference-price wording appeared on 26.99%, and explicit deal or percentage-off wording on 7.17%.910
Locate the card before comparing it
A digital shelf is a group of cards under a particular heading. “Best for Oily Skin,” for example, supplies a use context for the products beneath it. Overall P1 is the first card across the answer, while first in a heading identifies the leading card in one group. First in a later heading applies that comparison to groups after the first.11
In a preserved scissors response, Fiskars SoftGrip appeared fourth overall and first in the second heading. It led one shopping group after three products had already appeared in another. Across the headed-answer sample, 66.5% of heading leaders appeared after overall P1.1213
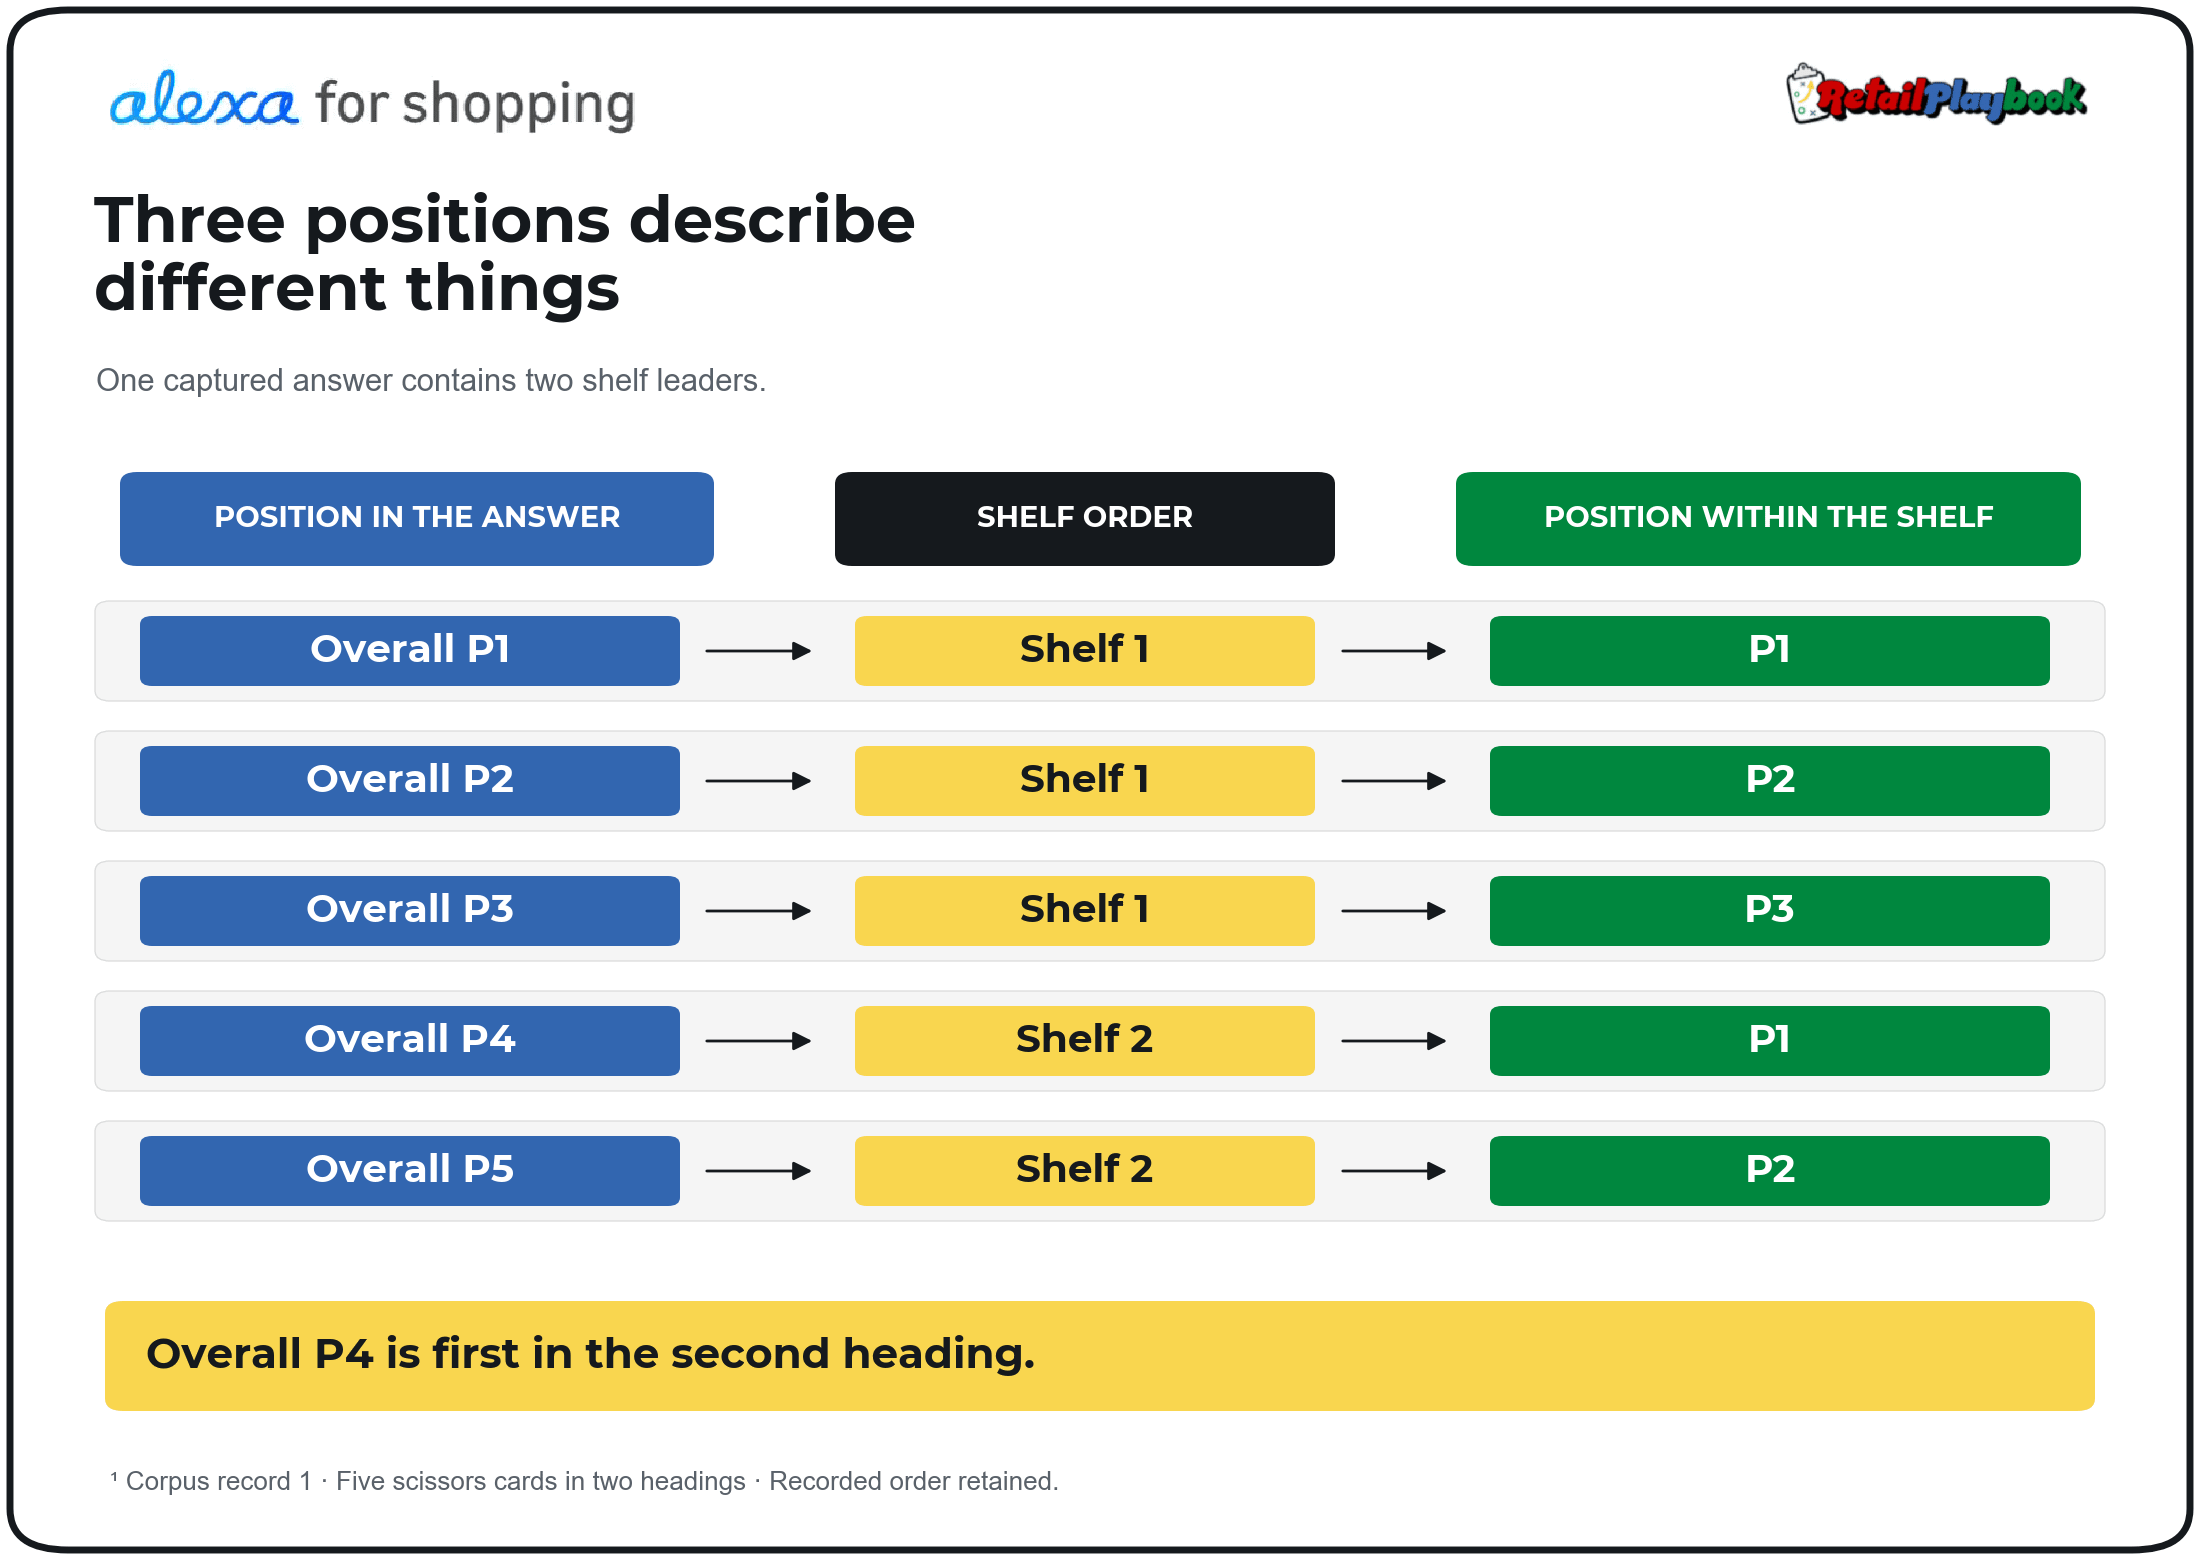
For a brand, reporting both positions preserves the result. A group leader may appear farther down the complete answer. Adding another product to an earlier group changes that overall position even if the later group stays in the same order.
1. Review depth holds up inside a heading
Review count had the strongest adjusted association with earlier placement among the structured attributes in the rank model. In pairwise comparisons with unequal review counts, the leading card had more reviews in 62.7% of overall comparisons, 62.4% of within-heading comparisons and 60.6% of later-heading comparisons.1415
Moving from the complete answer into one heading preserved most of this relationship. Review depth therefore provides competitive context even after the comparison is narrowed to products grouped together by Alexa. A higher count describes more accumulated feedback, while the star rating describes its score.
Price followed a weaker pattern. Lower-priced offers led 54.6% of overall comparisons, 51.4% of within-heading comparisons and 51.2% of later-heading comparisons. Package size, configuration and the proposed use therefore matter before drawing a pricing conclusion from the smaller advantage inside headings.16
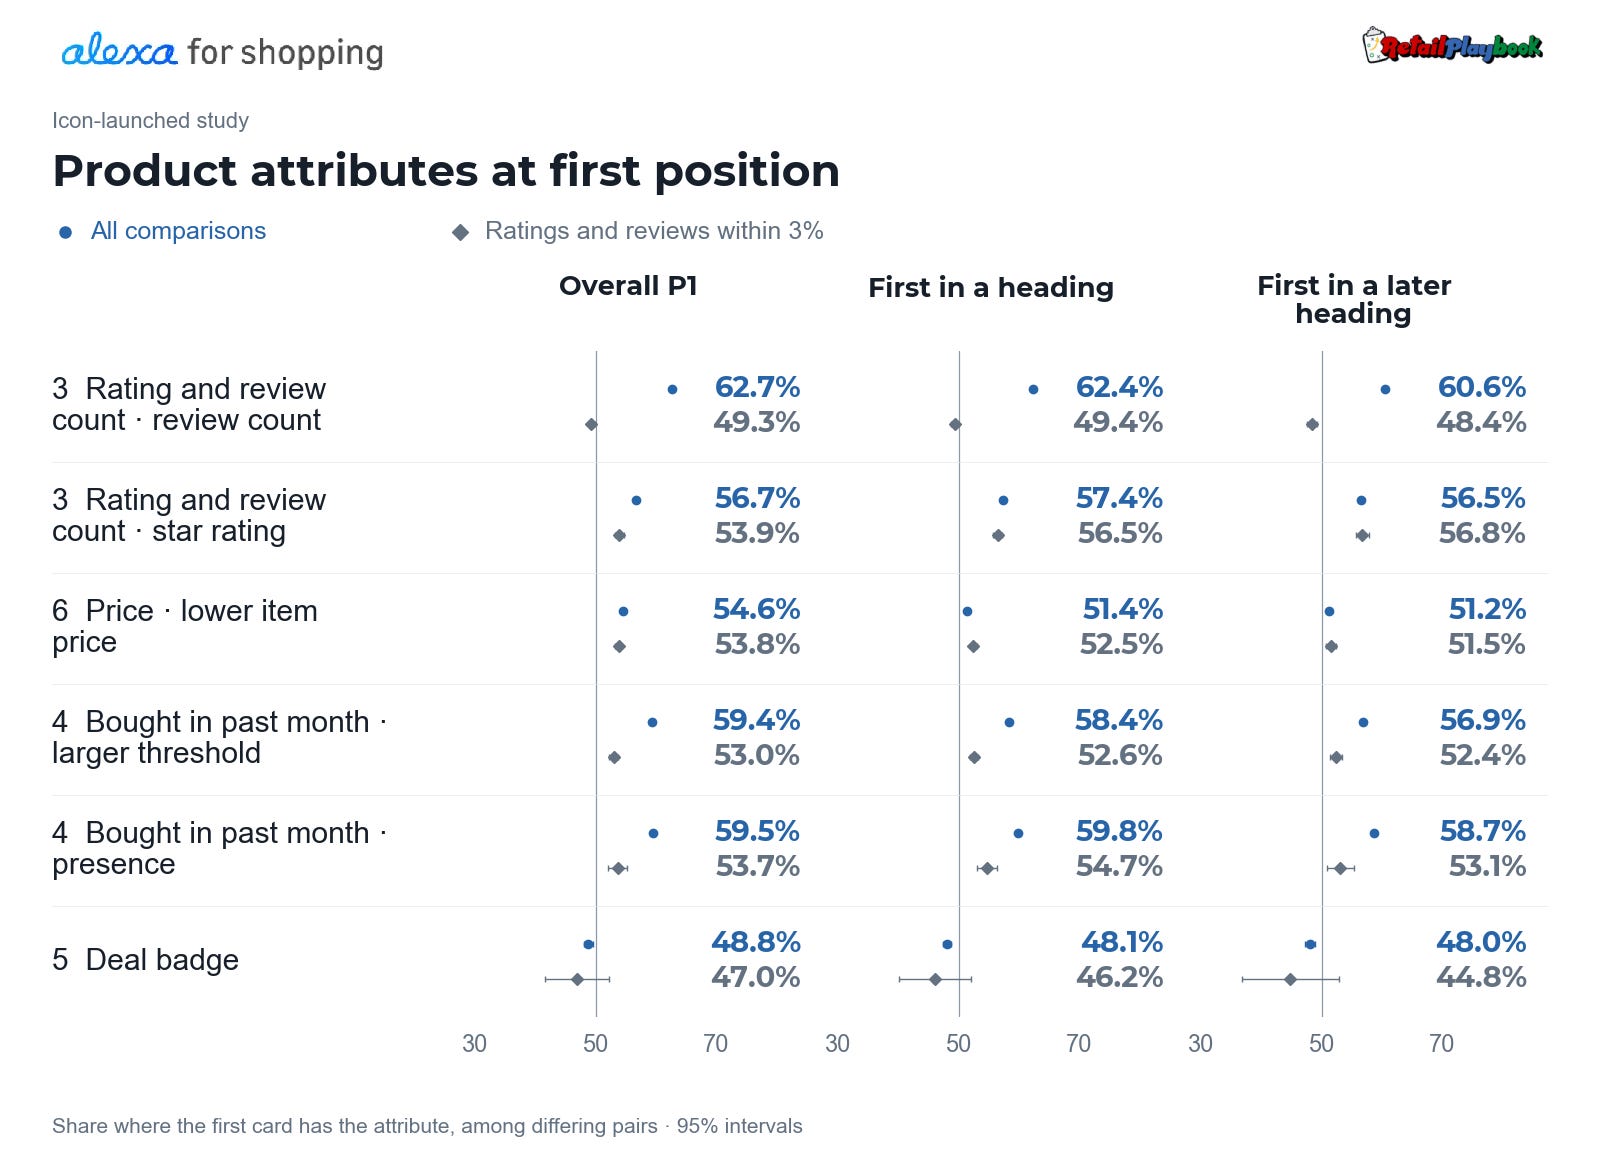
A rating gap calls for reading the feedback, a review-count gap concerns accumulated customer evidence, and a price gap requires a comparable offer. Each points to different work. Adding review evidence, revising a product fact and changing an offer price involve different owners and should follow the issue the comparison actually exposes.
2. Similar customer evidence brings title wording and price forward
I next compared offers whose star ratings and review counts were each within a 5% relative difference. Among those pairs, title–prompt word match received 63.9% of the additional held-out model improvement, and lower item price received 29.5%. A card with both advantages held overall P1 in 60.1% of qualifying comparisons.17
Those percentages allocate the improvement in a comparison model. Together, the measured factors predicted the first card correctly in 57.3% of held-out comparisons, against a 50% baseline. That level of performance supports reviewing the fields together while leaving substantial uncertainty about an individual result.
Requiring identical star ratings changed the order. Lower price then received 59.3% of the improvement and title matching 34.9%. Title wording and price remain important to the review, but their relative contribution depends on how closely the competing offers are matched.18
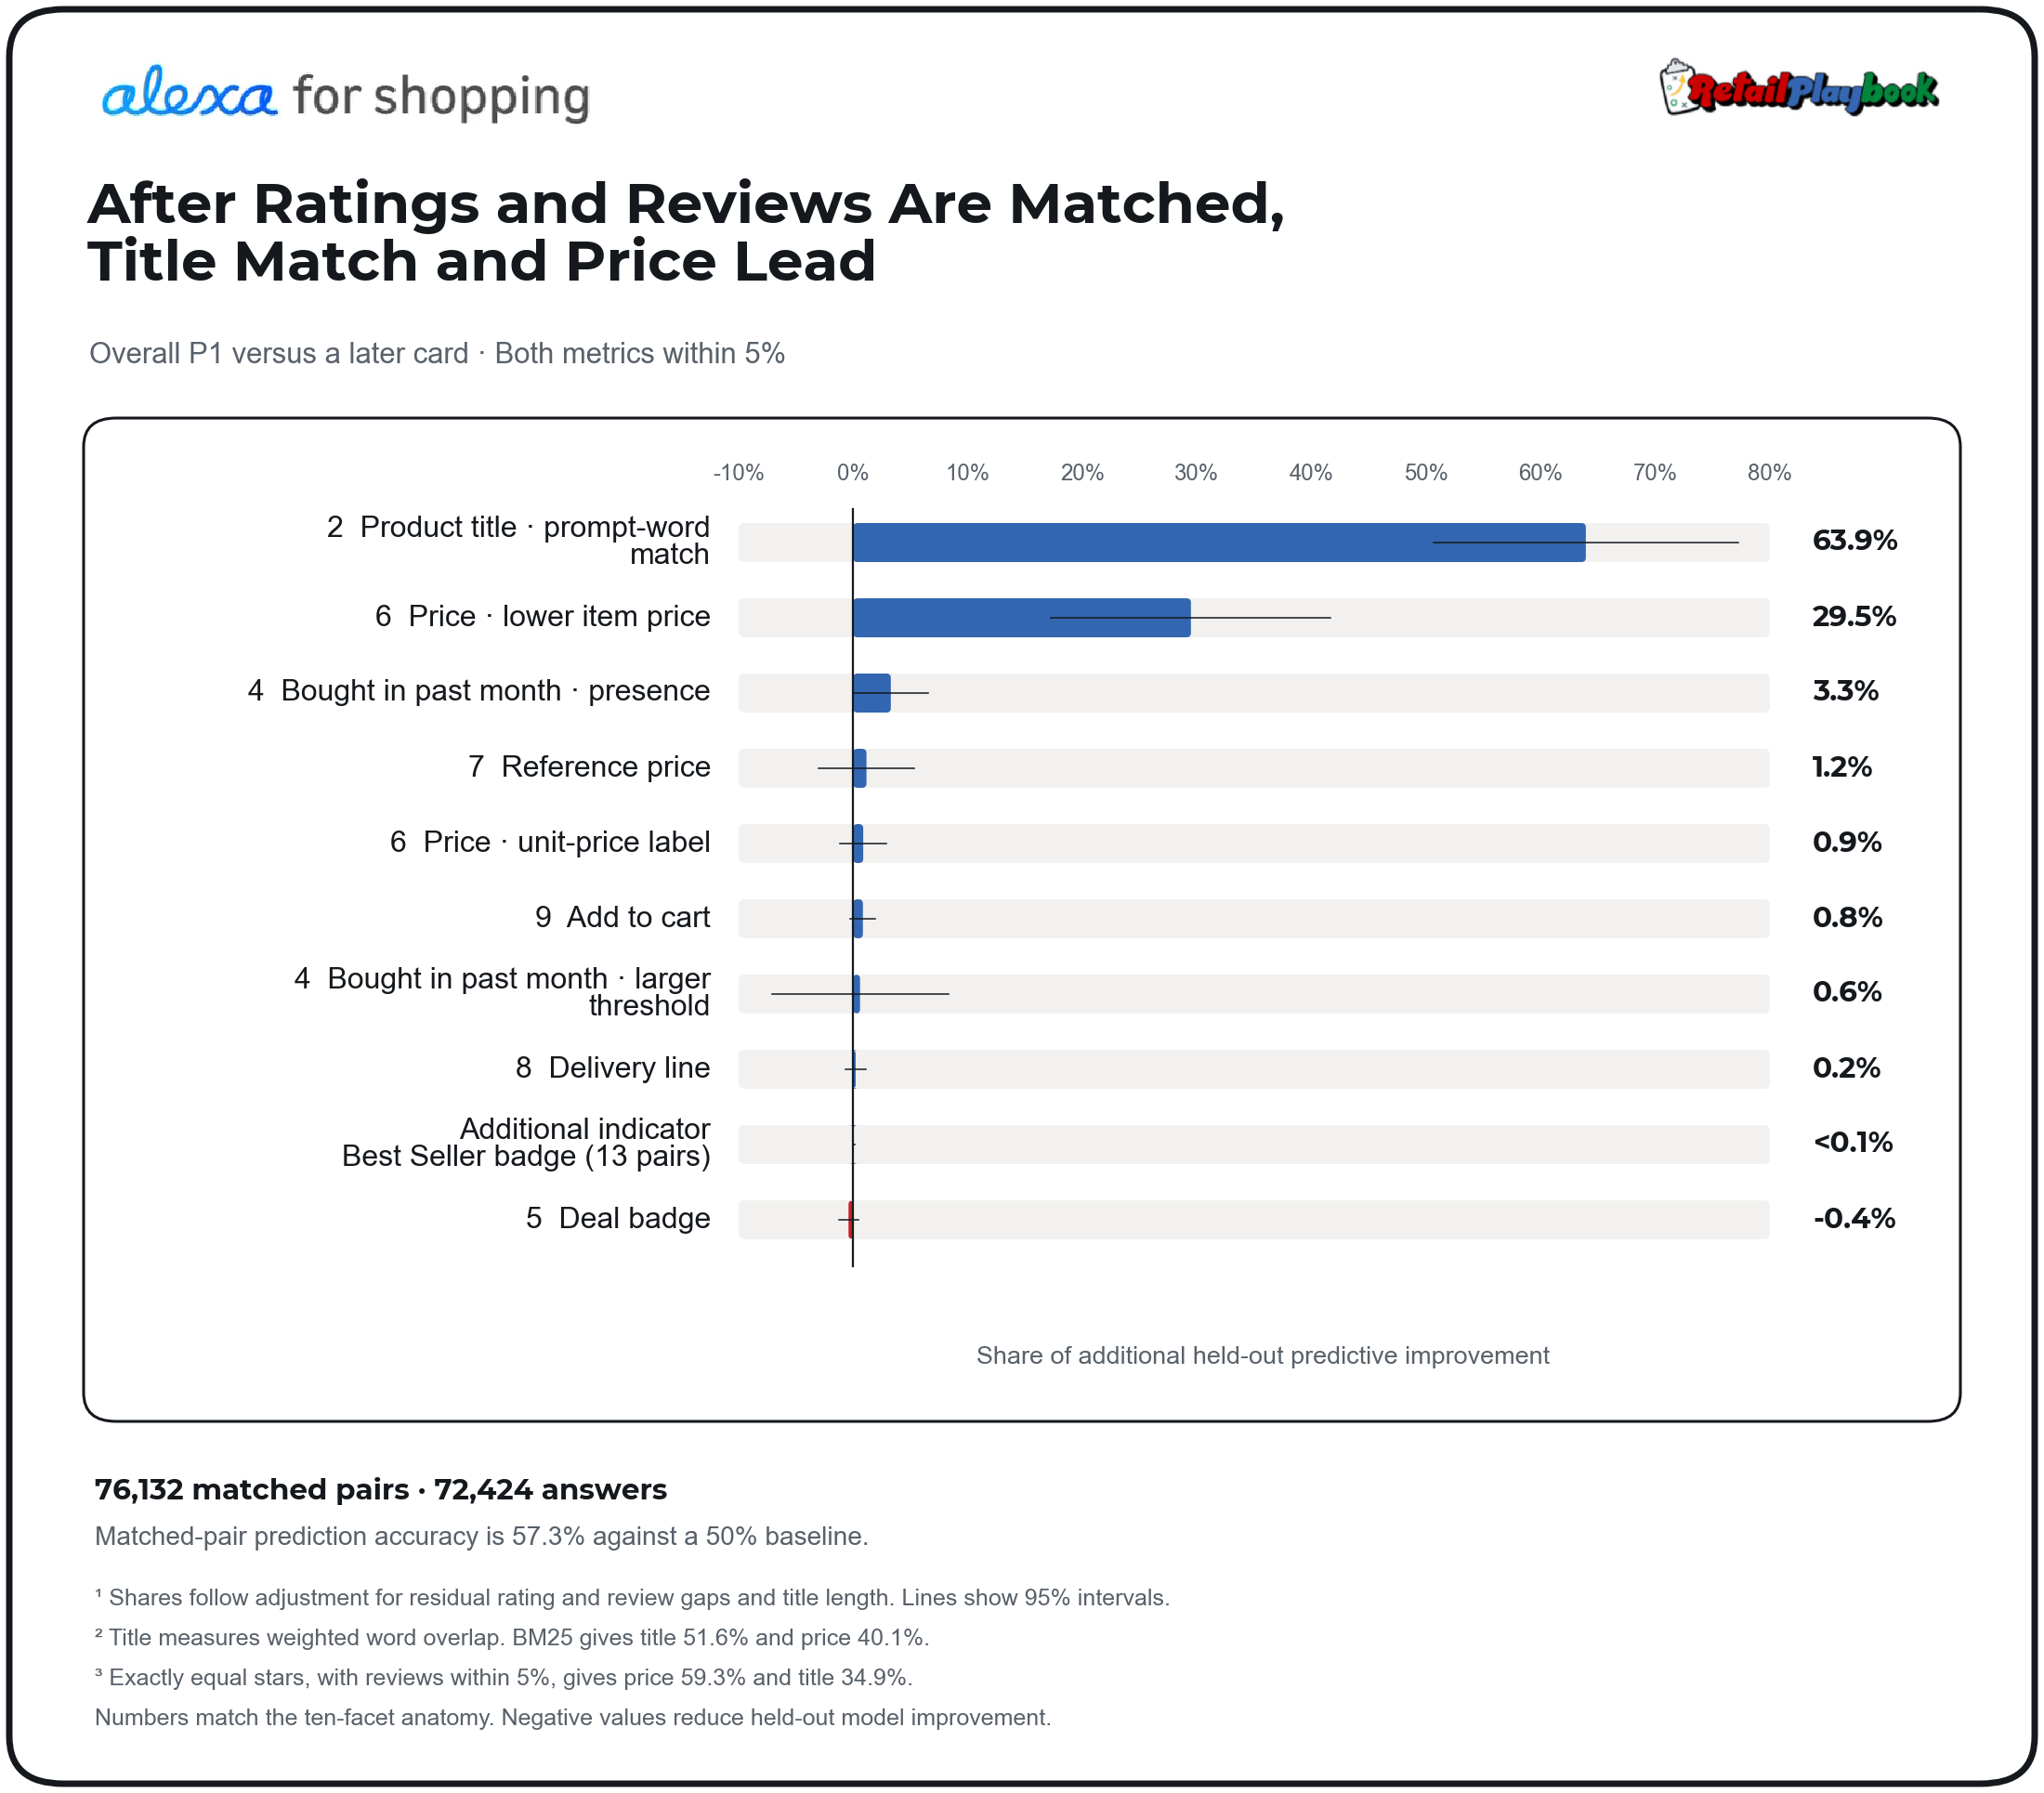
Title matching here measures overlap with the shopper’s words. A brand still has to establish whether those words describe the exact product and a supported use. Adding a phrase becomes a defensible content change when it makes a relevant product fact clearer.
Inside headings, purchase-activity measures accounted for larger shares of the model improvement than they did in the overall-P1 comparison. This adds another reason to preserve bought-in-past-month information separately from the star rating and review count.19
What the matched pen pair reveals
Two PILOT FriXion Clicker offers appeared together under “Best for Mistake-Free Writing (Erasable).” Both showed 4.7 stars, and their review counts differed by about 0.30%, satisfying the tighter 3% comparison rule. Within that heading, the seven-pack appeared before the ten-pack.2021
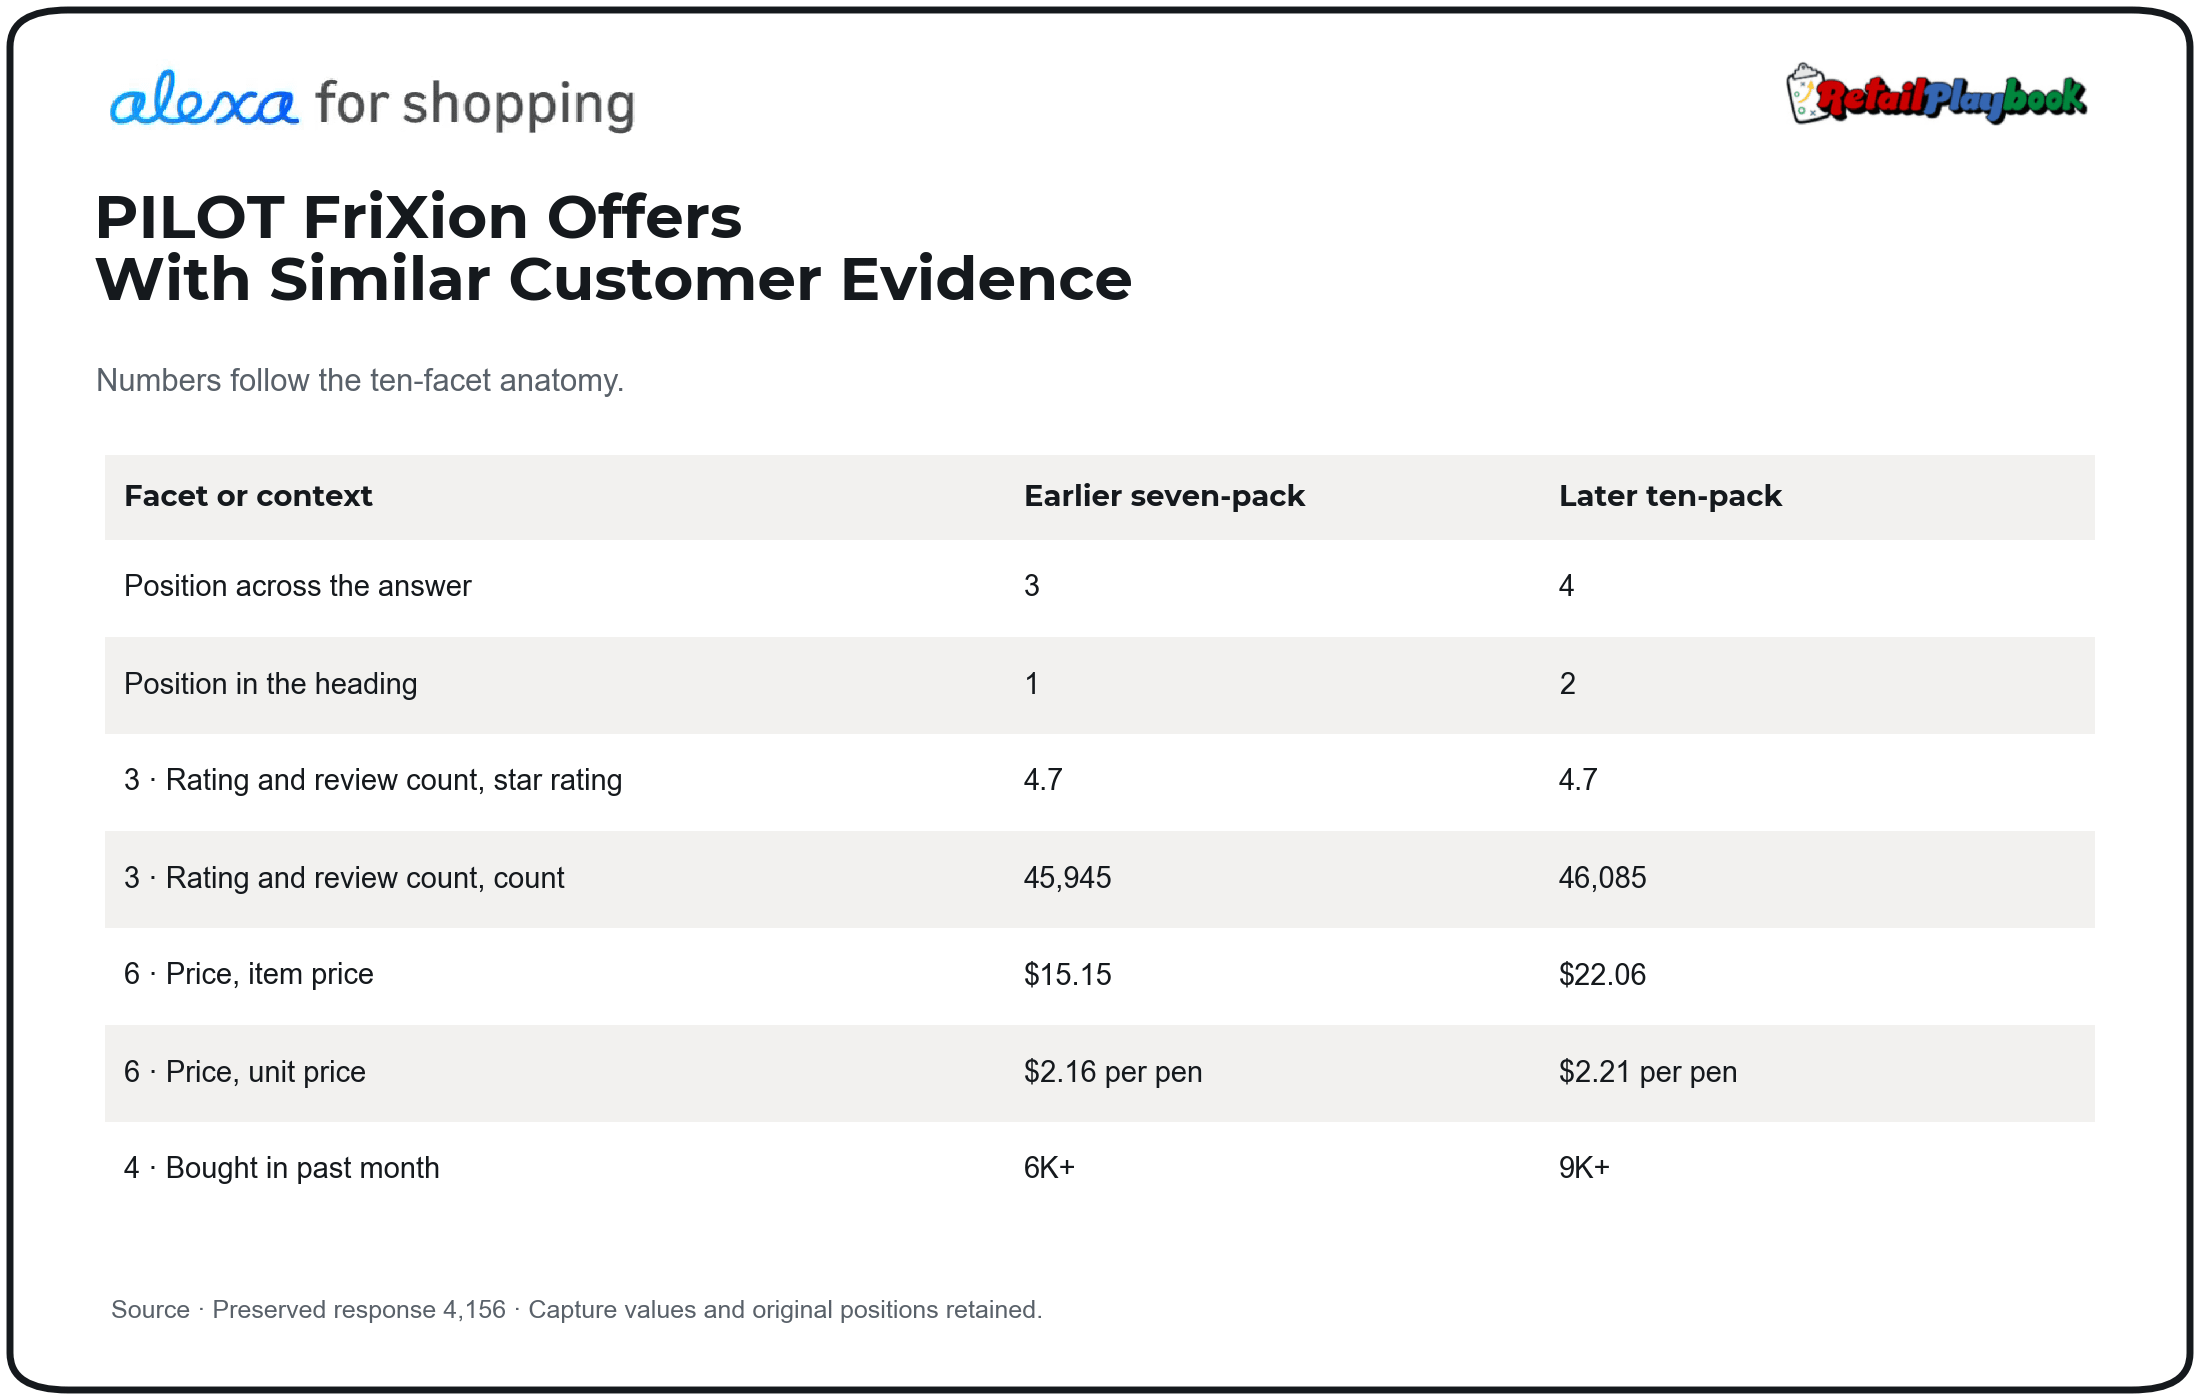
Buying the ten-pack added three pens and came with a higher displayed purchase threshold. Its price per pen was also higher. Similar ratings and review counts made those differences easier to inspect while pack quantity and unit price remained separate buying considerations.
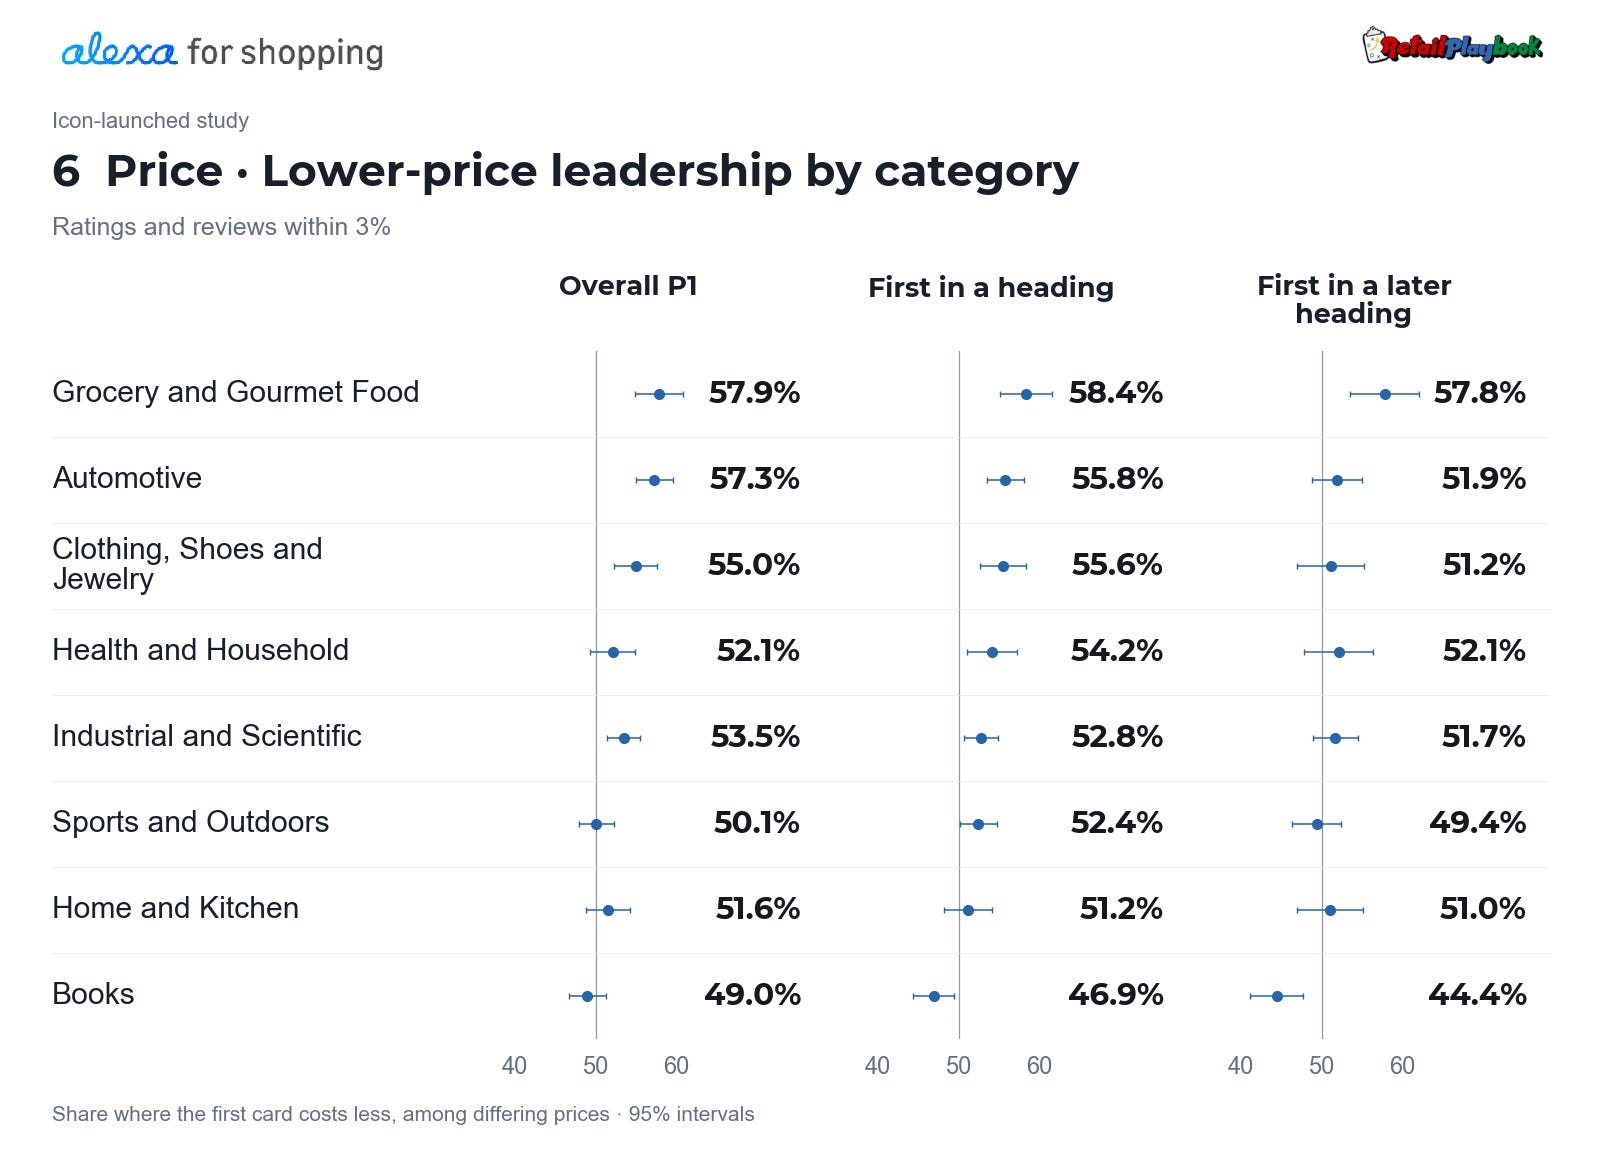
Category also changed the price pattern. In the 3%-matched within-heading comparisons, lower-priced offers led 58.4% of Grocery & Gourmet Food comparisons and 46.9% of Books comparisons. A grocery comparison needs a quantity and unit-price check, while a book comparison needs the edition and format. Electronics adds configuration and included equipment.2223
3. Recommendation language changes with position
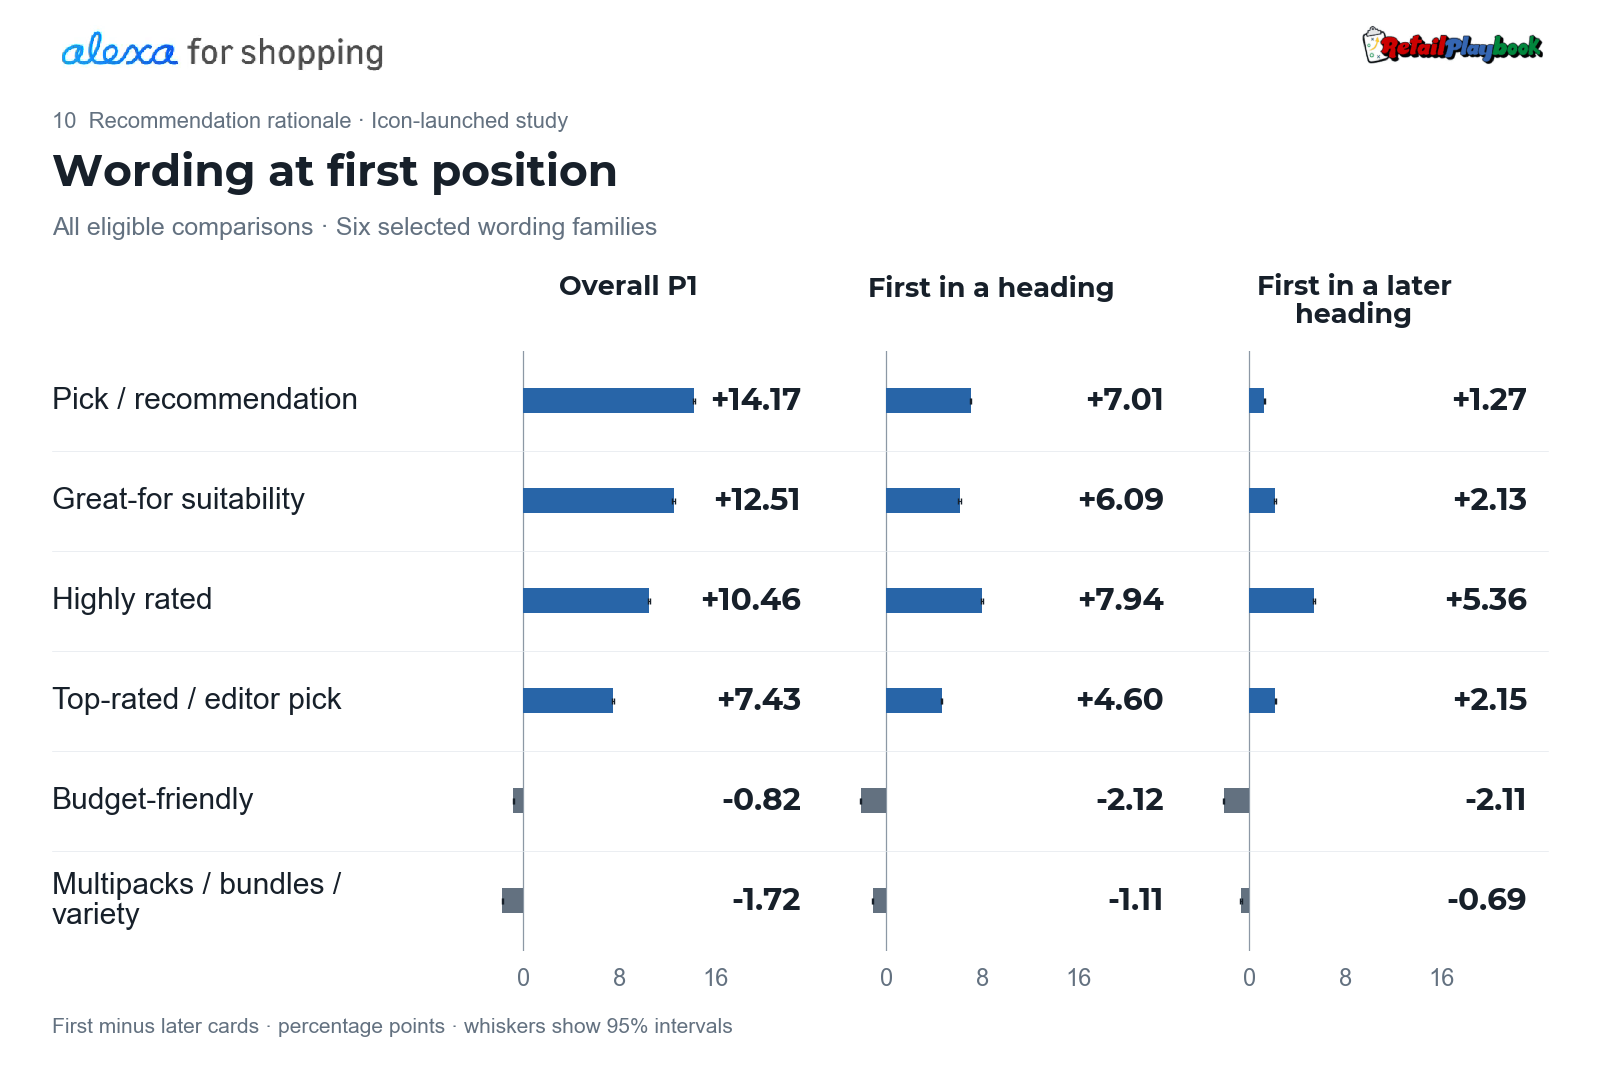
Explicit pick or recommendation wording was 14.17 percentage points more prevalent on overall P1 than on later cards. That advantage fell to 7.01 points for first in a heading and 1.27 points for first in a later heading. An opening-card endorsement and a later heading leader therefore have different language patterns around them.24
I read the rationale for the reason it gives the shopper. GoPro’s travel recommendation needs support from the selected camera’s features. For the pens, the proposed use raises a question about whether the writing must remain permanent.
In that captured teacher response, Alexa described FriXion as suitable for annotation, correction and planning, then extended the advice to a teacher doing a lot of grading. PILOT’s product-family documentation excludes examination papers and other writing that must remain permanent. Alexa’s response omitted that condition.25
Erasability can help with working notes and lesson plans. Grading introduces a question about whether the marks must last. “Will these marks need to remain permanent?” would have clarified the requirement before extending the recommendation across those tasks.
Turn the finding into a specific correction
Give the catalog or product-content owner one complete answer, the selected offer and the source passage relevant to the disputed claim. A price or delivery discrepancy belongs with the owner of those offer terms. A missing product condition belongs with the content owner once the omission is confirmed in the source.
If the product information already carries the condition, preserve it alongside the conflicting answer for escalation. After a confirmed correction, repeat the shopper request and record whether the product returns, both positions and whether the condition appears. Product return and condition preservation each need their own count.26
For the FriXion case, the immediate question is whether the source supports the grading advice and communicates the permanence restriction. Success in the next answer means carrying that condition through the recommendation. A change in rank answers a separate question about placement.
Connect the card to the shopping mission
My 100K study examined how shopper requests became semantic shelves and product explanations. This larger study follows that process into the individual offer. It shows why review depth belongs in the competitive comparison, why title and price need comparable alternatives, and why a persuasive rationale needs the conditions that make its proposed use appropriate.27 100K study, Part 1 · Part 2
A useful optimization recommendation should identify the source field, offer term or missing condition that requires attention. It should also specify what to look for in the next answer. That gives the brand a change it can make and an outcome it can inspect.28
Continue with the optimization series
My seven articles on Agentic Commerce Optimization (ACO) develop the product-page practices behind this work. They cover product identity, Noun Phrase Optimization, Semantic Bridging, Inference Optimization, search planning and Product Page Coverage. Read them alongside the exact offer and shopper question under review.
Start with the overall framework for connecting search, product information and the shopping mission. Alexa for Shopping: the New Playbook for Agentic Commerce Optimization on Amazon
See how Product Name and Item Highlights divide product identity from supporting detail. Titles in the WILD: Real Examples of Amazon Product Name and Item Highlights
Build precise product language around complete noun phrases. The Ultimate Guide to Noun Phrase Optimization the foundational language for Amazon SEO and ACO
Connect product facts to supported uses, customer needs and constraints. Semantic Bridging on Amazon: the Art of Expanding Meaning while Protecting Demand
Trace a proposed fit claim back to the facts and evidence needed to support it. Inference Optimization: Get to the Conclusion Before Alexa for Shopping Does
Connect the shopper’s mission with relevant search families and the product information those searches require. A9 + QPO: Mapping Search Demand to the Shopping Mission on AFS
Check whether the whole page answers the questions that can change the buying decision. Product Page Coverage: Where the Buying Decision Comes Together for the AGENT and CUSTOMER
Main-image pixels are reproduced exactly as supplied by the author. Its control tags are qualified in the caption. Brands submit titles, images and product facts, while Amazon selects the catalog contribution displayed. Seller control of price and shipping options applies to the seller’s own offer. Promotions require eligibility and review, and reference-price displays depend on validation. Generated recommendation wording belongs to Amazon’s response construction. Product detail pages and offers, Seller promotions, and Amazon Science.
Percentages are answer-balanced directional shares among pairs with unequal values for that attribute. Each answer receives equal weight, divided equally among eligible headings and then among eligible comparisons within a heading. Fifty percent represents parity. Missing values are excluded separately for each attribute. Numeric purchase thresholds are compared where both cards have such a badge. Primary prices retain the captured dollar fields, which can omit cents. Best Seller comparisons in the matched sample were sparse. Complete counts and 95% intervals clustered by exact prompt are in the numeric comparison table.
Counts are 8,473,602 captured product-card appearances across 1,681,395 recorded responses in 18 preserved CSV exports, collected September 19–October 5, 2026. Repeated appearances and repeated research captures are included. Product-card appearances are the counting unit, with unique product and shopper totals outside this measure. Source inventory and file hashes were checked against the preserved research corpus. Corpus links require ChatGPT sign-in.
Amazon documents access through the Alexa icon and assistance integrated into search in its guide to Alexa for Shopping, updated October 29, 2026. “Automatic-in-search beta” identifies the configuration discussed in the research brief. Public documentation describes multiple search features and rollouts without establishing their relative usage or identifying every test configuration. This article’s empirical results cover the icon-launched corpus.
Facet numbers follow the new main image exactly. Submeasurements retain their parent number, including star rating and review count under 3, purchase-text presence and purchase threshold under 4, and item price and unit price under 6. Prime-deal wording is a subtype of deal badge 5. Best Seller remains an additional indicator outside the ten-facet anatomy. Image presence remains unmeasured in the corpus. Rationale presence is measured only in the selected aligned subset. Semantic-shelf headings and positions are contextual fields outside the ten facets. Canonical facet definitions.
Availability and arrangement vary across interfaces and captures. Annotated components form an inspection framework. Structured exports contain a narrower field set than the full response, and most exported cards lack an ASIN. Product-title matching and exact variation verification remain separate tasks. Statistical comparisons use the fields actually recovered. A visible control records an available action. Purchase badges record displayed thresholds. Image quality, delivery speed, and completed shopping actions were outside these rank-comparison measures. GoPro’s anatomy diagram is the author-supplied main illustration. Its capture date and link to an individual statistical-corpus record remain unverified.
See footnote 6.
Amazon Science describes generating display markup and querying internal systems to populate a streamed answer, using the term hydration. This is a published account of response construction, dated October 4, 2024. Attribution of an individual field or claim in these captures to a particular input requires additional evidence from that response. Amazon Science technical account.
Counts refer to complete-capture card appearances in the icon-launched corpus. Excluding incomplete records and the exact “Select this product to compare” placeholder leaves 8,262,044 appearances. Repeated products and research captures remain included. Title presence is nonblank structured title text, price presence is a positive parseable dollar field, ratings are valid positive star values, and review counts are parseable values including zero. Review count refers to the export’s reviews field, and written-review totals were not independently reconciled. Purchase activity is measured through a numeric bought-in-past-month badge captured in the structured field. Displayed thresholds do not establish a sales rate or change over time. Full counts and definitions.
Independently aligned card text covers 7,116,587 cards across 1,008,050 responses, or 86.14% of the complete-capture cohort. Alignment uses card boundaries and title or unique metadata matches, without requiring Add to cart or a semantic heading. Percentages describe that selected subset. Reference-price counts require explicit List, Typical, Was or Original price wording. Deals require recognized deal or percentage-off wording before the offer price. Prime fulfillment-badge frequency remains unmeasured because the visual badge is not reliably retained in the export. Prime-deal wording is an offer label and appears on 1.32% of aligned cards. Counts, extraction criteria and limits.
Verified reconstruction identified 6,486,477 card appearances across 897,648 answers, containing 2,681,809 explicitly delimited shelves. Boundaries were recovered from “see more” markers and one-to-one aligned card blocks in the flattened response text. Unresolved alignment, ambiguous boundaries, metadata conflicts, and placeholders were excluded. Comparison figures use this headed-answer population with their own eligible subsets. First in a heading is evaluated against later cards under that same heading, and first in a later heading is evaluated in headings after the first. Definitions, populations, and validation.
This example is preserved response 1 and its extracted cards, checked against the original local CSV export. Fiskars SoftGrip is fourth overall and first under the heading “Single Pair (If They Just Need One Good Pair).” All five cards in the captured answer show 4.8 stars.
Structural counts use the fully aligned headed-answer subset and count each observed shelf once, including singleton shelves and repeated research appearances. Eligibility required at least two cards in an answer. Higher heading orders include only answers that reach that heading. Overall P1 is also first in the first heading in this subset. Singleton shelves numbered 335,348, or 12.50% of all 2,681,809 reconstructed shelves. They are included in the 66.5% later-heading share. Restricting the count to shelves with at least two cards gives 63.0%. Attribute comparisons elsewhere require eligible later cards and use their own weighting and matching rules. Complete structure statistics, category results, and definitions.
Earlier rank-based modeling used 7,928,180 cards in 1,165,540 answers. Adjusted within-answer correlations were +0.124 for higher review count, +0.068 for lower captured price, and +0.057 for higher star rating. Purchase-badge, Best Seller, and deal indicators were also included. In-sample within-answer R² was 2.78%. Purchase-label presence had an unadjusted within-answer correlation of +0.0426 and an adjusted correlation of −0.0028. These values concern the presence indicator rather than the numerical purchase threshold. These correlations and the first-position comparison shares are different descriptive statistics. Most within-answer rank variation remains unexplained by these recorded attributes. The model provides limited support for predicting where an individual product will appear. Full rank analysis.
See footnote 2.
See footnote 2.
The Overall-P1 analysis contains 76,132 matched pairs across 72,424 answers selected from the aligned common cohort. Each pair satisfies 2 × abs(a − b) / (a + b) ≤ 0.05 separately for positive star rating and review count. A paired model retains residual rating and review-count gaps and title length as controls. Exact Shapley allocation divides additional held-out improvement across ten measured factors, including submeasurements of the same facet and one additional badge indicator. Overall-P1 prediction accuracy is 57.35% against a 50% pairwise baseline. Within-heading results cover 58,194 pairs and 56,085 answers. Titles use IDF-weighted stemmed word coverage, with BM25 as a sensitivity check. Identical-star-rating results retain a 5% review-count tolerance. Intervals cluster exact prompts and are conditional on fitted models. Combined-feature results are exploratory associations among returned cards. Requiring identical star ratings changes the importance ordering, with lower price contributing 59.3% and title matching 34.9%. Relative importance therefore depends on the matching tolerance. Title matching measures word overlap with the request. Suitability for the intended use requires separate verification. Full matched analysis, intervals and sensitivity checks.
See footnote 17.
See footnote 17.
A pair qualifies when 2 × abs(a − b) / (a + b) ≤ 0.03 for both star rating and review count. For example, 4.4 and 4.5 stars can qualify. Numeric comparison populations contain 33,228 answers overall, 29,727 for first in a heading, and 15,846 for first in a later heading before factor-specific exclusions. Corresponding explanation populations contain 20,609, 18,453, and 9,787 answers. Sensitivity checks using identical star ratings and title-only shelf alignment retained the positive lower-price association. Sensitivity results.
Preserved response 4,156, checked against the original CSV and the validated pair arrays. Both PILOT FriXion offers appear at overall positions 3 and 4, first and second in heading 2. Both have 4.7 stars. Their review-count gap is 2 × abs(45,945 − 46,085) / (45,945 + 46,085) = 0.00304249, or 0.30425%, which satisfies the 3% rule. Prices and unit prices quoted here use the rendered response text, including cents. Structured price fields omit cents. This example is selected to explain the match, pack-size differences, and differing purchase labels. Population-level effects are reported in the aggregate tables. Preserved response 4,156.
Categories retain the first segment of the original category path, with no inferred merging. Displayed category cells require at least 500 eligible answers. Eight groups meet that threshold in all three comparisons and appear in the category visual. In the matched first-in-a-heading price comparison, Grocery & Gourmet Food contains 1,142 eligible answers and Books contains 1,691. Their lower-price shares are 58.38% and 46.89%, with 95% intervals of 55.19–61.58% and 44.39–49.40%. Complete category results.
Electronics has a lower-price adjusted within-answer correlation of +0.1419 in the whole-answer model. Its 3%-matched first-in-a-heading price comparison contains 798 eligible answers and 867 pairs, with an answer-balanced leading-card share of 46.58% and a 95% interval of 43.01–50.15%. Its interval includes 50%. Model and matched comparison use different eligible populations, controls, and outcomes. Category comparisons.
Wording analysis uses the existing 19 fine families and 12 broad themes reconstructed from the earlier explicit-text rules. Rules can overlap. Simplified wording figures show the four largest positive overall differences, budget-friendly positioning, and multipacks. Simplified theme figures show reviews, delivery, use case, value, performance, and quality. Complete figure views retain all 19 wording families and 12 themes. Explanations must satisfy the validated card-to-text matching criteria, giving full-sample comparison populations of 579,482 answers overall, 578,210 for first in a heading, and 551,408 for first in a later heading. Percentage-point differences and prevalence ratios use equal-answer and equal-eligible-heading weights. Generated descriptions and displayed order are observed together, leaving causal direction unresolved. After matching ratings and review counts within 3%, the overall-P1 and later-heading advantages were 12.58 and 1.33 percentage points, respectively. All language results and intervals.
This is an answer-level case from preserved response 4,156, completed September 19, 2026 at 06:21:11 UTC. Full response text was checked against the original CSV. Both pen titles identify PILOT FriXion Clicker 0.7 mm. Its seven-pack rationale recommends annotation, correction and planning, and its closing advice explicitly includes grading. Captured text contains no restriction concerning permanent writing, examination papers or heat-sensitive ink. PILOT’s UK FriXion Ball Clicker page supplies the product-family restriction. Its current English use-and-care guide, page 2, supplies the temperature instruction. Both were inspected November 11, 2026. With no ASIN in the source record, verification concerns the PILOT FriXion pen family and the answer’s wording. A current product-page defect, the source used to generate the September answer, and a post-correction outcome remain unestablished. Proposed follow-up actions are identified as proposals in the text. Follow-up measures should distinguish source correction, observed answer behavior and unresolved dependencies. Stable rank can coexist with a better explanation. Repeated output alone cannot establish that an edit caused a change. Case evidence and audit.
See footnote 25.
This section uses the 6,486,477-card headed subset of the 8,473,602 captured appearances. Review and wording results use their respective eligible comparison samples and the answer-balanced methods detailed in the comparison notes. Earlier and current estimates refer to their own study populations. Cross-study record overlap remains unmeasured. Independent replication or change over time would require a common comparison design and an overlap audit. Recommendation wording and displayed order were observed together.
A reader companion collects complete figures, aggregate tables, classification rules, population definitions and sensitivity checks. Its source inventory gives the file-level counts and hashes for all 18 preserved exports. Case pages reproduce the relevant saved excerpts for the scissors response and the FriXion comparison. Research companion
The 66.5% figure is the one I'd show any brand still reporting a single rank for AI shopping answers, since most heading leaders would look like a loss on that report. A quick check is to rerun your top prompts, log both overall position and position within the heading, and count how many apparent drops were really first place in a later group.